Project: Genome Circuit Figure Creator
Over the last week or two I have been building a small web app to help create genome figures for use in scientific papers. All it really does is draw arrows and stuff with labels using SVG, but is a lot more accurate in terms of scaling than the normal method which is using powerpoint. You can either manually put in each gene and length to map, or just upload a genbank file and have it create the figure automatically.
The application is built on Angular 2 and hosted here temporarily.
The source code is on my Github.
I curerntly work at the Mills lab part time, It is a microbiology lab focused on milk and infant gut microbiome studies at UC Davis. One of the graduate students in the lab brought up the issue that there are no tools to create high resolution gene figures even though they are used widely throughout the field of microbiology and many other fields. So as the part time employee/intern I was tasked with creating it, and for the most part I think it turned out pretty good.
Here is an example of a genbank file for a bifodobacterium you can try on the app. GenBank File
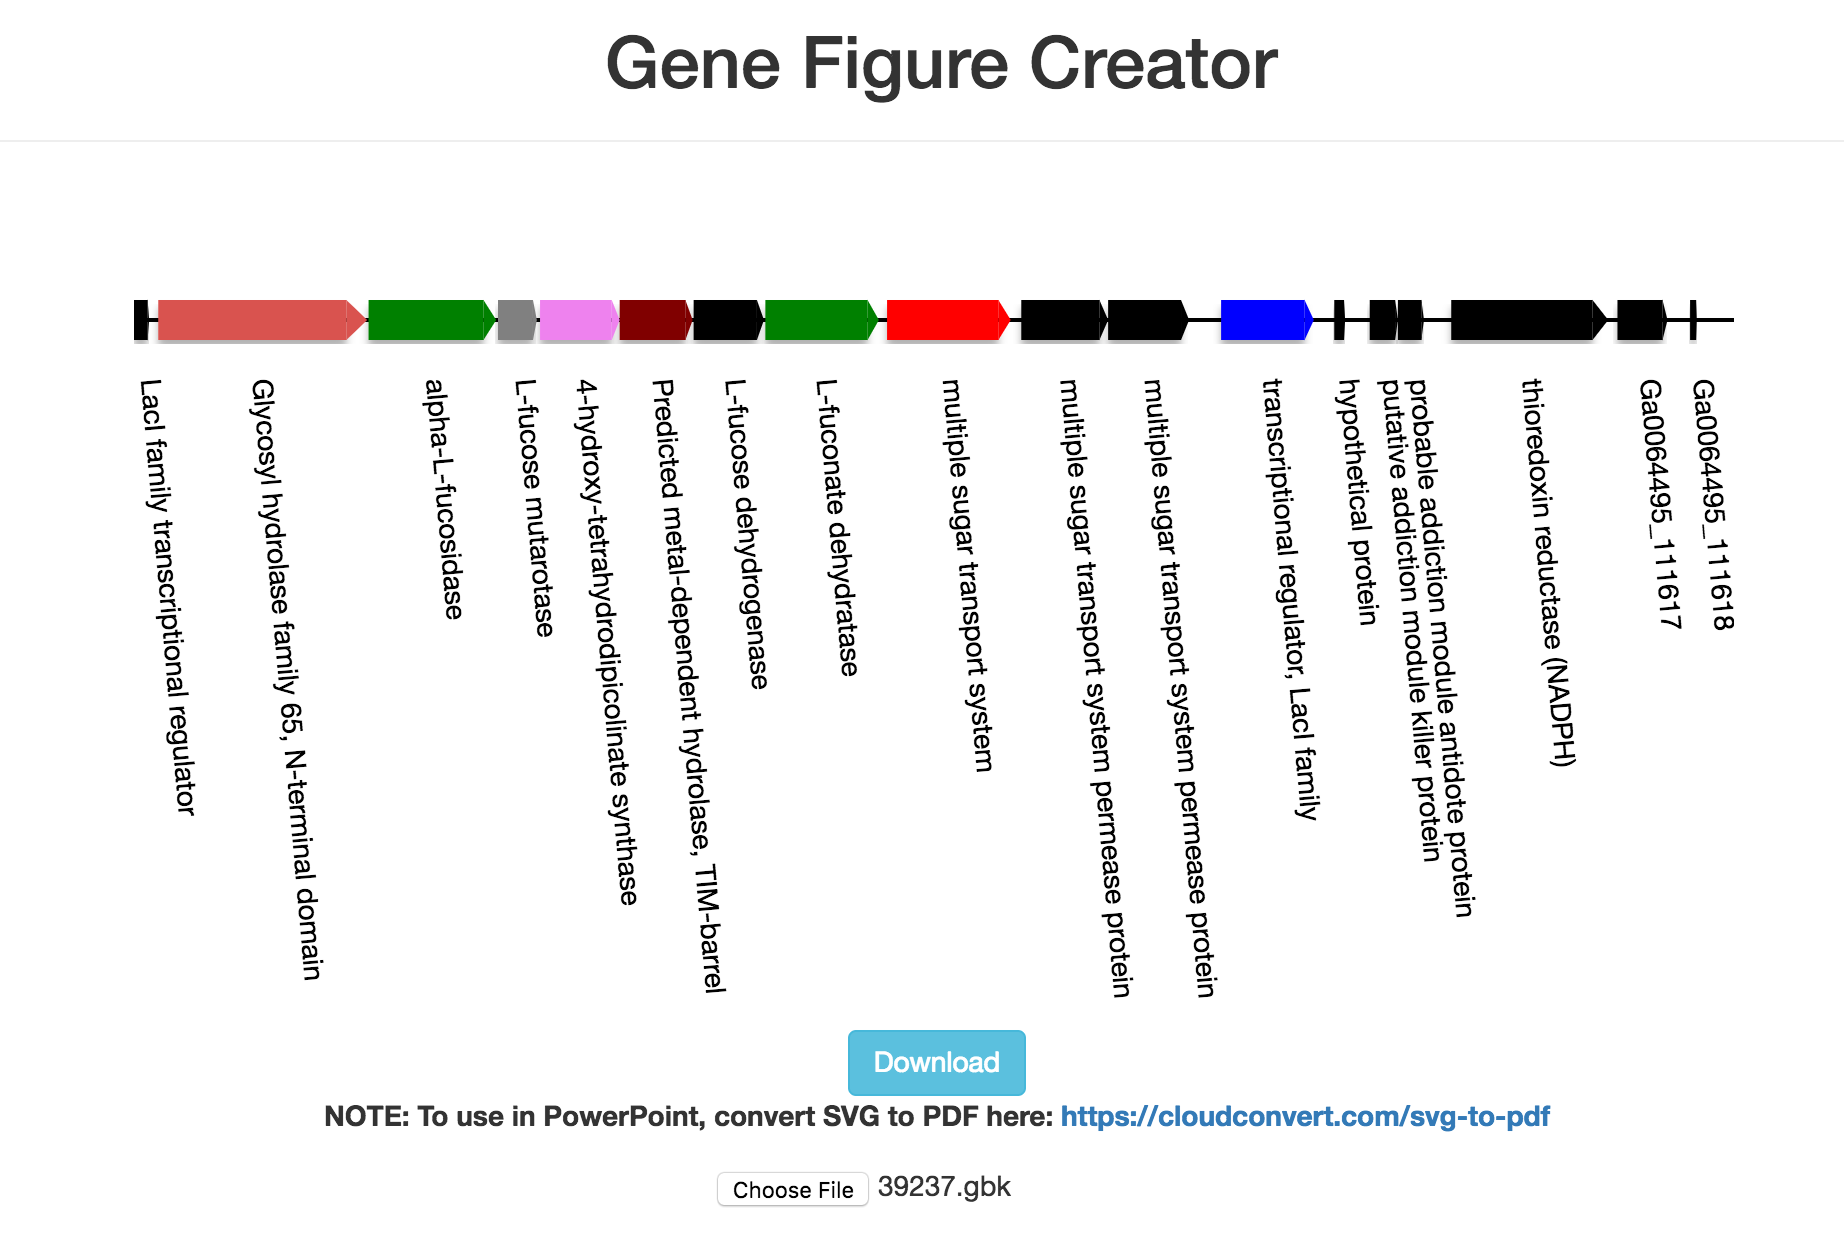
The output looks like this:

Using the tool
To create a gene diagram you may either upload a genbank file or manually input genes to create a figure.
Overall Figure Options:
Max Length: The number of base pairs of the largest genome you will be comparing your figure too. This is in order to keep everything scaled relative to a maximum. For example if you have three species to compare, find the length of the longest and set Max Length to that one.
Block Height: Scale between 0 and 100 to determine how tall/thick each gene is
Arrow Length: Fixes length of arrows on blocks to be a percentage (0.00-100). Recommended to be 1 or below.
After changing any of the above options the reload button must be hit.
Individual Gene Options:
Gene: Name of gene
Length: Length in base pairs of gene
Color: Color of block, either in english(red,green,blue,maroon,etc.) or hex (#ffffff)
Direction: Forward (right facing arrow) or backward (left facing arrow) for gene. Non Coding sets color to trasnparent.
Arrow Only: Checkbox to determine if the gene should only be a triangle and no rectangular portion.
Notes
– Arrow length is as a percent of total SVG width
– When parsing GenBank files overlaps of <10bp are set to 0. Anything >than 10bp overlap is deleted
– Gene names from GenBank files are the predicted function by default. Will be set to the Locus_tag if no predicted function, and if neither name is set to “No Name”
–Samir
