
· Samir Akre-Bhide · Technical · 2 min read
I Wore Two Glucose Monitors at Once: Stelo vs Lingo
Two weeks of wearing a Stelo and Lingo simultaneously revealed correlated trends but a 20 mg/dL calibration gap. This is why you need an A1C baseline to interpret a CGM.
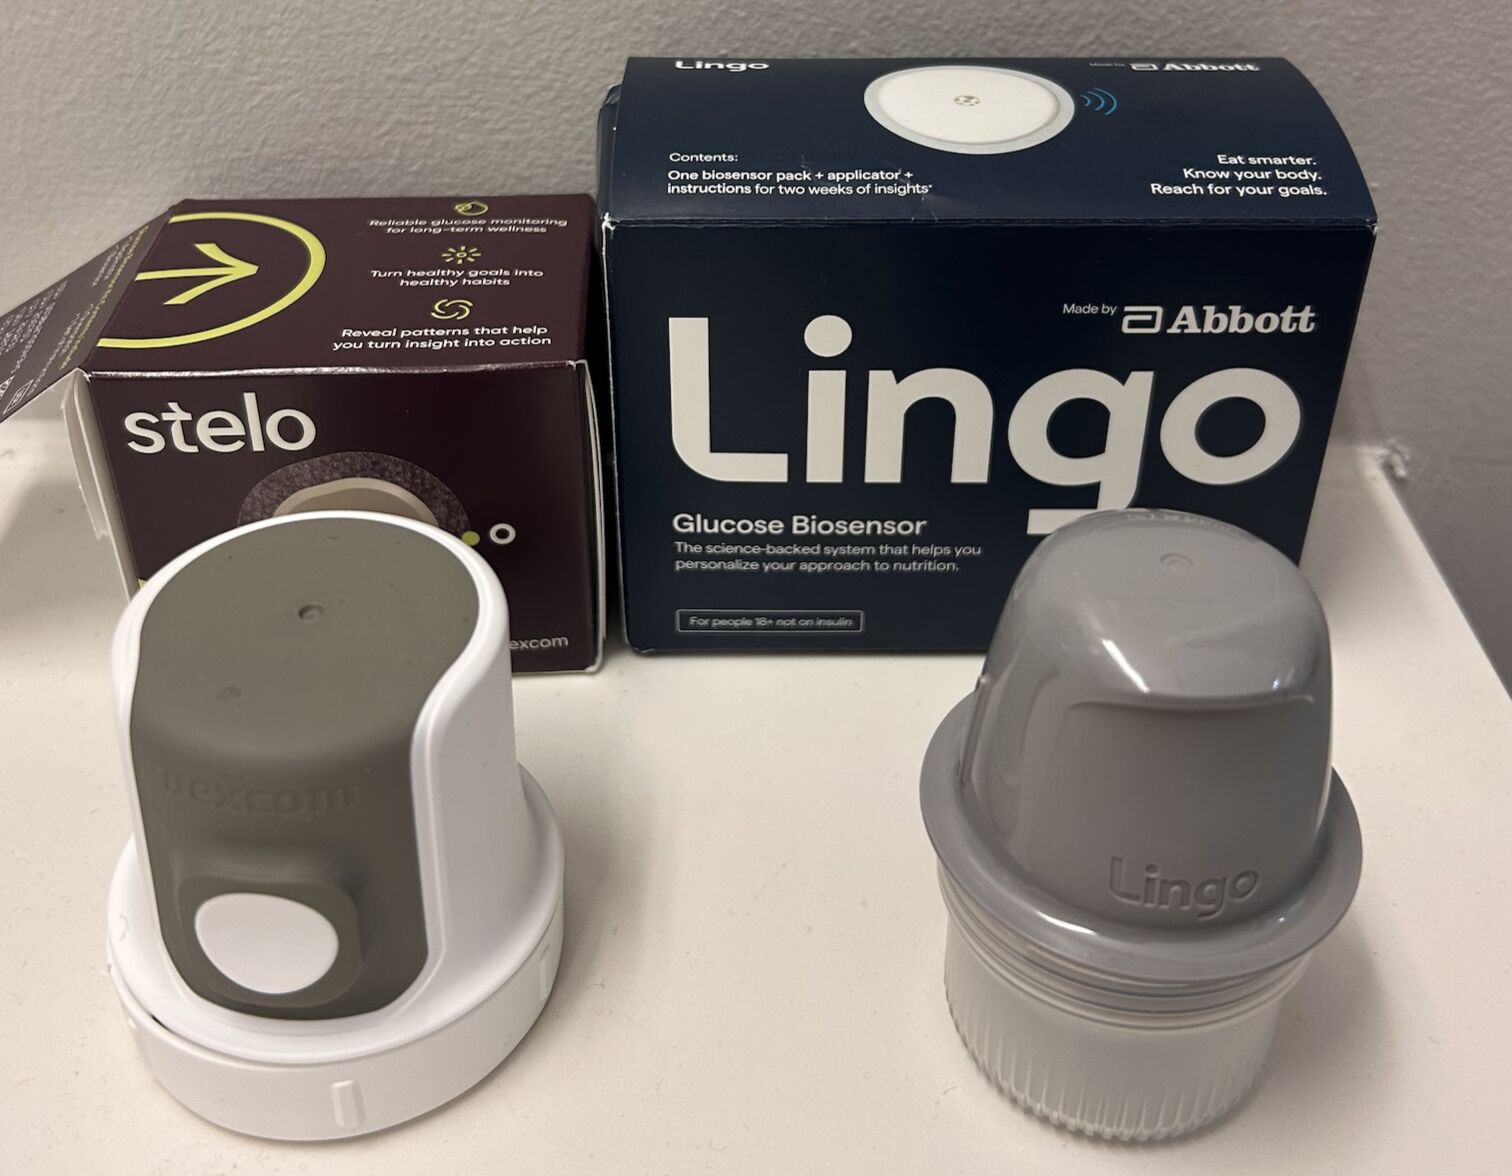
I wore 2 consumer/over-the-counter glucose monitors for 2 weeks, one on each arm. Between the two I didn’t know why I’d pick one over the other so I got both.
There’s growing research showing associations between glucose monitoring and mood, depression, and anxiety in people with diabetes. I think these devices could be really valuable tools in digital health and mental health settings even outside of diabetes care — but I haven’t seen much quantitative comparison of OTC glucose monitors in the literature, so I wanted to see how they stacked up against each other.
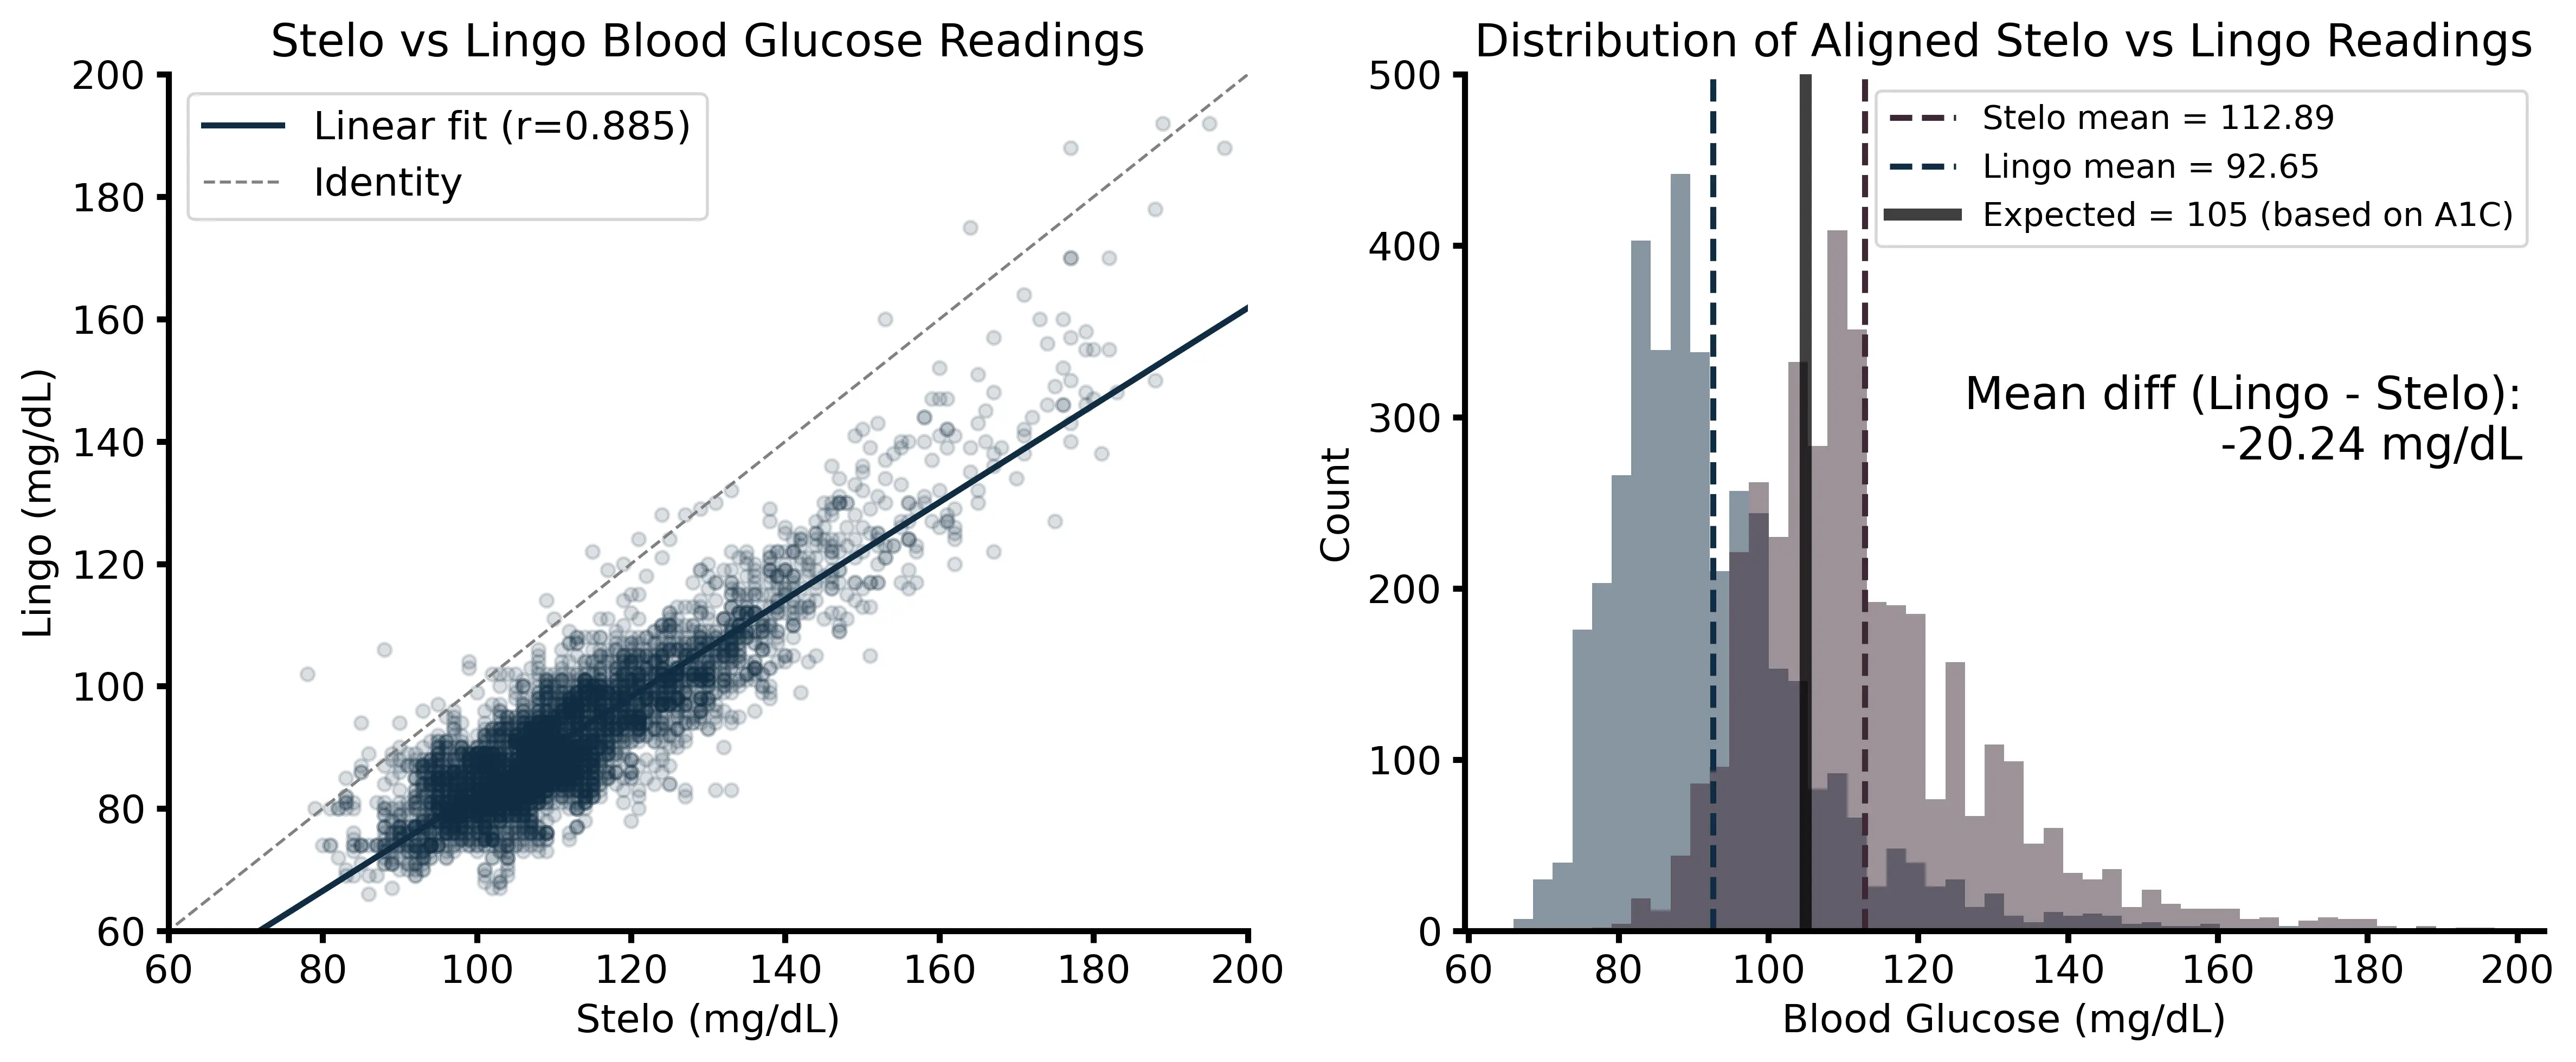
The two devices correlate pretty well (r=0.89) but there’s a 20 mg/dL difference between them, which is substantial. The left panel shows how aligned the readings are in terms of trends — points cluster along the regression line even if they’re not on the identity line. The right panel makes the calibration gap hard to miss: Stelo averages 113 mg/dL and Lingo averages 93 mg/dL, with the A1C-expected value of ~105 sitting right between them. They essentially average out to the correct value.
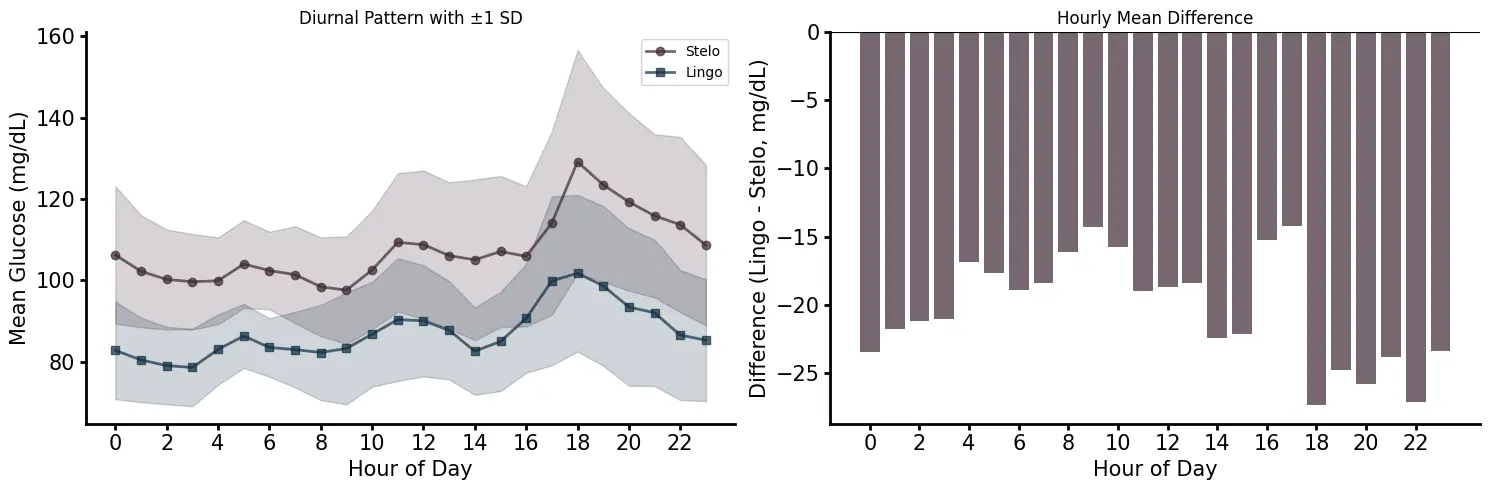
Looking at patterns across the day confirms this. Both devices track the same daily shape — lowest in the early morning hours, peaking in the evening — but the gap between them is consistent across every hour. The offset isn’t noise; it’s a stable calibration difference baked into each sensor.
My takeaway for future CGM use: get a hemoglobin A1C measurement first to see how “off” a given sensor might be on absolute values, but I’d feel confident that the relative changes and trends are accurate.
Not intended to be a rigorous comparison — still figuring out how these data can be used outside of the context of diabetes management. Let me know if you have suggestions on how to look at this data!